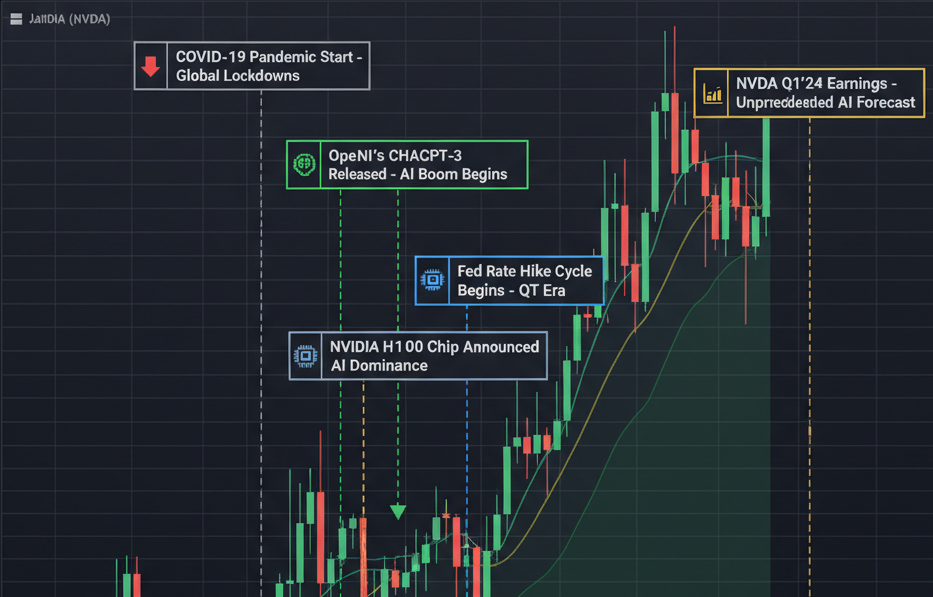
See How History Moves Markets

The first stock analysis platform that correlates major historical events with price movements, giving retail investors the context they need to make smarter decisions.

🔒 Bank-Level Security
Real-Time Data
📱 Mobile Friendly
ContextStock Dashboard showing NVIDIA stock with historical event correlations

Why Smart Investors Choose ContextStock

Finally understand the "why" behind every major market movement with our revolutionary event correlation technology

📊

Visual Event Correlation

See exactly how political events, economic announcements, and technological breakthroughs impact stock prices with our proprietary timeline visualization.

🎯

Curated Event Database

Access our expertly curated database of 50,000+ significant events across politics, economics, technology, and industry-specific milestones.

🧠

Pattern Recognition AI

Our AI identifies recurring patterns between similar events and stock movements, helping you anticipate market reactions to future events.

Stop Guessing. Start Understanding.

  • Discover why stocks moved 30% overnight
  • Identify investment opportunities before the crowd
  • Build confidence with historical context
  • Make data-driven decisions, not emotional ones
  • Learn from market history in visual format
89% Users Report Better Decision Making
23% Average Portfolio Improvement
50K+ Historical Events Tracked
2.4s Average Load Time

How ContextStock Works

Get started in under 60 seconds with our intuitive three-step process

1

Search Any Stock

Simply enter any stock symbol or company name. Our platform supports all major exchanges and 10+ years of historical data.

2

View Event Timeline

Instantly see major events overlaid on your stock chart. Click any event for detailed impact analysis and related market movements.

3

Make Informed Decisions

Use historical patterns and event correlations to time your trades better and understand market sentiment shifts.

What Our Users Say

Join thousands of retail investors who've transformed their trading strategy

"Finally I understand why my tech stocks crashed in 2022. The Fed rate hike timeline made it so clear. This tool is a game-changer for retail investors like me."

SM

Sarah Martinez

Retail Investor, 3 years

"I wish I had this during COVID. Seeing how previous pandemics affected markets would have saved me from panic selling. The historical context is invaluable."

JC

James Chen

Individual Investor, 7 years

"The NVIDIA AI boom visualization helped me understand the magnitude of the opportunity. I bought in early 2023 after seeing similar patterns from the internet boom."

ER

Emily Rodriguez

Part-time Trader

Start Your Free Trial Today

No credit card required. Cancel anytime. Full access to all features.

$2/mo

after 14-day free trial

  • ✅ Unlimited stock searches
  • ✅ 50,000+ historical events
  • ✅ Real-time event updates
  • ✅ Mobile & desktop access
  • ✅ Advanced pattern analysis
  • ✅ Export charts & reports
  • ✅ Email alerts for tracked stocks
  • ✅ 24/7 customer support
Start Free Trial - No Credit Card

💯 30-day money-back guarantee
🔒 Cancel anytime, no questions asked